Stop Stocking the Same Bra Shape: A Cup-Type Assortment Matrix for Independent Lingerie Retailers
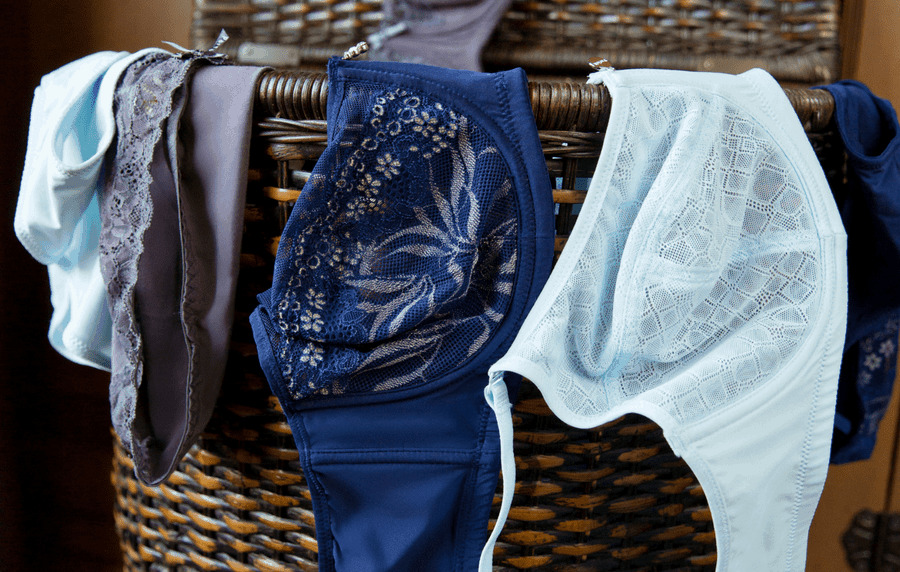
Walk into almost any independent lingerie store and you’ll see the same wall: a rainbow of seamless T-shirt bras in every nude and black, all in the same molded cup. The owner is proud of it. It looks full, it photographs well, and it was easy to buy. Then a customer walks in, asks for a 32G, and gets a shrug. She leaves. She doesn’t come back.
I’ve seen this exact pattern in order data from dozens of small retailers. One molded cup style often eats 40–60% of a store’s bra buy because it feels “safe.” The result is predictable: size gaps drive walkouts, the dominant style gets marked down anyway because it’s overbought, and the customers who needed a different shape never got a chance to spend money with you.
This guide is a spreadsheet-first fix. No hype, no vague advice. You’ll get four numbered steps: map your customer bust-size distribution, assign cup types to customer segments, set SKU ratios per cup type, and set reorder triggers. Then you’ll learn how to read sell-through data to adjust the whole thing. Treat every ratio here as a starting point, not a commandment.
Step 1 — Map Your Customer Bust-Size Distribution Before You Buy Anything
You cannot allocate SKU ratios without knowing who actually walks through your door. Most independent retailers order based on gut feel or whatever the last wholesale catalog pushed. That’s not a plan; that’s a guess with a credit card attached.
Here’s how to collect real bust-size data in 60–90 days:
- Pull 90 days of POS size data. Export every bra sale by size. If your POS doesn’t track size, start requiring staff to log it at the register. A simple tally sheet works.
- Count fitting-room requests that ended in a walkout. Keep a clipboard in the fitting room. Every time a customer asks for a size you don’t have, write it down. This is your demand signal for gaps.
- Ask your two best-selling brands for their regional size mix. Use it as a sanity check, not gospel. Their national data won’t match your store, but a wild mismatch means you’re missing something.
- Review online return reasons and exchange data. If you sell online, fitting-room tallies are useless. Instead, look at why customers return: “too small in the cup,” “band too tight,” “cup gaped.” Those reasons tell you which sizes you’re under-serving.
A realistic example distribution for a mixed-size boutique might look like this: 30B–34B at 22%, 34C–36C at 31%, 36D–38DD at 27%, 38E+ at 12%, and 8% scattered across hard-to-find sizes. Label this as a hypothetical store example, not an industry standard. Your numbers will differ.
One warning: sample bias is real. If your fitting room only attracts certain customers, your data skews. That’s why you cross-check with POS and brand data. The distribution is your baseline, and you will revisit it every quarter.
Step 2 — Assign Cup Types to Customer Segments (Not Just Sizes)
A 36DD customer and a 36B customer are not the same shopper, even if they buy the same brand. Size tells you what fits. Cup type tells you what she needs. A size-only matrix misses shape, coverage, and occasion.
Here’s a segmentation framework I’ve used with boutiques that finally stopped guessing:
- Everyday comfort seekers — full cup, soft wire, seamless. They want coverage and all-day wear. Product implication: stock full-cup basics in core nudes and black.
- Occasion and eveningwear buyers — plunge, balconette. They need lift and shape for a specific outfit. Product implication: keep a small but deep run of plunge styles in 32–38 bands.
- Younger or smaller-bust shoppers — bralette, demi. They want style and light support. Product implication: bralettes in XS–L, demi cups in 30–34 bands.
- Full-bust and plus-size customers — full cup, minimizer, high-apex styles. They need structure and support. Product implication: this is where you cannot skimp on size depth.
- Active and lifestyle customers — sports, wireless. They want movement control. Product implication: sports bras in encapsulated styles for larger cups.
I once worked with a boutique that stocked only plunge bras because the owner loved them. Full-bust customers never returned. The fix wasn’t a new marketing campaign; it was adding two full-cup styles in 36–40 bands. Walkouts dropped within a month.
Write your segment names on the left of a spreadsheet and list 2–3 cup types per segment on the right. That becomes the skeleton of your cup type matrix. Weight each segment by your Step 1 data, not by your personal taste.
Step 3 — Set SKU Ratios per Cup Type (With Sample Matrices by Store Type)
Now you translate segments into SKU allocation. The table below gives you starting ratios by store type. These are illustrative first drafts, not universal rules. Your customer base is the input; the ratio is the output.
| Cup Type | Boutique (walk-in, mixed sizes) | Plus-Size Focused | Online-Only |
|---|---|---|---|
| Full cup | 30% | 40% | 25% |
| Balconette | 20% | 15% | 20% |
| Plunge | 15% | 10% | 20% |
| Demi | 10% | — | 10% |
| Bralette | 10% | — | 15% |
| Sports | 10% | 10% | 10% |
| Minimizer | — | 20% | — |
| Other | 5% | 5% | — |
Why these numbers? A boutique serves a mixed walk-in crowd, so it needs breadth across everyday and occasion shapes. A plus-size focused store cannot copy a boutique’s ratio and expect it to work—her customers need full cup and minimizer depth first. An online-only store has no fitting room, so it leans on bralettes and plunge for style-driven shoppers who are more comfortable buying without a try-on.
Here’s how to translate percentages into units. Say you have a 600-unit buy across 12 SKUs. A boutique full-cup allocation of 30% means 180 units. If those 180 units spread across 5 full-cup styles, that’s 36 units per style—enough to test depth without overcommitting. Adjust style count based on how many sizes each style covers. If a cup construction isn’t available in your size range, a custom lingerie program can fill the gap before you commit to a full buy.
These ratios are a first draft. Step 4 is where you earn the right to change them.
Step 4 — Set Reorder Triggers and Read Sell-Through Data Like a Buyer
A matrix without reorder triggers is just a wish list. Sell-through data is the feedback mechanism that tells you which cup types are working and which are dead weight.
Start with these rules of thumb:
- Reorder when a SKU hits 70% sell-through within 8 weeks. That’s your velocity signal.
- Flag for markdown when sell-through is below 30% at 12 weeks. That’s your dead-stock signal.
- Review the full matrix quarterly. Not weekly, not annually. Quarterly gives you enough data without letting problems fester.
The formula is simple: sell-through rate = units sold ÷ units received. Worked example: 24 units received, 17 sold. 17 ÷ 24 = 71% sell-through. Trigger reorder.
Run a 15-minute weekly routine: pull the sell-through report, sort by cup type, flag anything above 70% or below 30%, and adjust the next buy. That’s it. No complicated dashboard needed.
What if a full-cup style sells out but a plunge style sits? Don’t blindly double down on the winner. Check whether the plunge gap is a sizing issue (you bought the wrong band range), a display issue (it’s hidden in the back), or a true demand signal (your customers genuinely don’t want plunge). The answer changes your next order.
The matrix is a living document. Review it quarterly, not once.
Verification: How to Know Your Matrix Is Actually Working
Set a 90-day check-in. Ask yourself three questions:
- Are fewer customers leaving without their size? Compare your walkout tally from Step 1 to the current month. A directional drop matters more than a precise number.
- Is my markdown pile smaller than last quarter? Aim to cut bra markdowns by a quarter within two quarters. If markdowns are flat, your ratios are still off.
- Are at least three cup types turning over at a healthy rate? If only one cup type sells, you’re back to the same trap with a fancier spreadsheet.
Keep the tone skeptical. If the numbers don’t move, the matrix needs adjustment, not more excuses. Verification is also a chance to re-interview staff. Ask them what customers are requesting that you still don’t stock. Their answers are free data.
Conclusion: Your Matrix Is a Starting Point, Not a Religion
The best bra matrix is the one you actually update. Here’s the framework in one breath: map your bust-size distribution, assign cup types to customer segments, set SKU ratios per cup type, and set reorder triggers. Then read sell-through data and adjust.
Every number in this guide—the sample ratios, the 70% reorder trigger, the 30% markdown flag—is a first draft. Your store will prove some of them wrong. That’s fine. The goal is fewer walkouts and less dead stock, not a perfect spreadsheet.
Your next task: this week, pull your POS size data and sketch your segment list. Next week, set your first reorder trigger. If you need a reliable sourcing partner for the full-cup and minimizer styles your customers keep asking for, FashionTIY offers low-MOQ wholesale bras with factory-direct pricing and quality checks, so you can test new cup types without sinking your whole buy budget into one shape. Start with one segment, one cup type, and one trigger. The rest follows.